Chart Echo is a finance & fintech tool designed to help users track and analyze market trends effectively. It is aimed at indie founders and small teams who need to make informed financial decisions without the complexities of large enterprise solutions.
What Chart Echo does
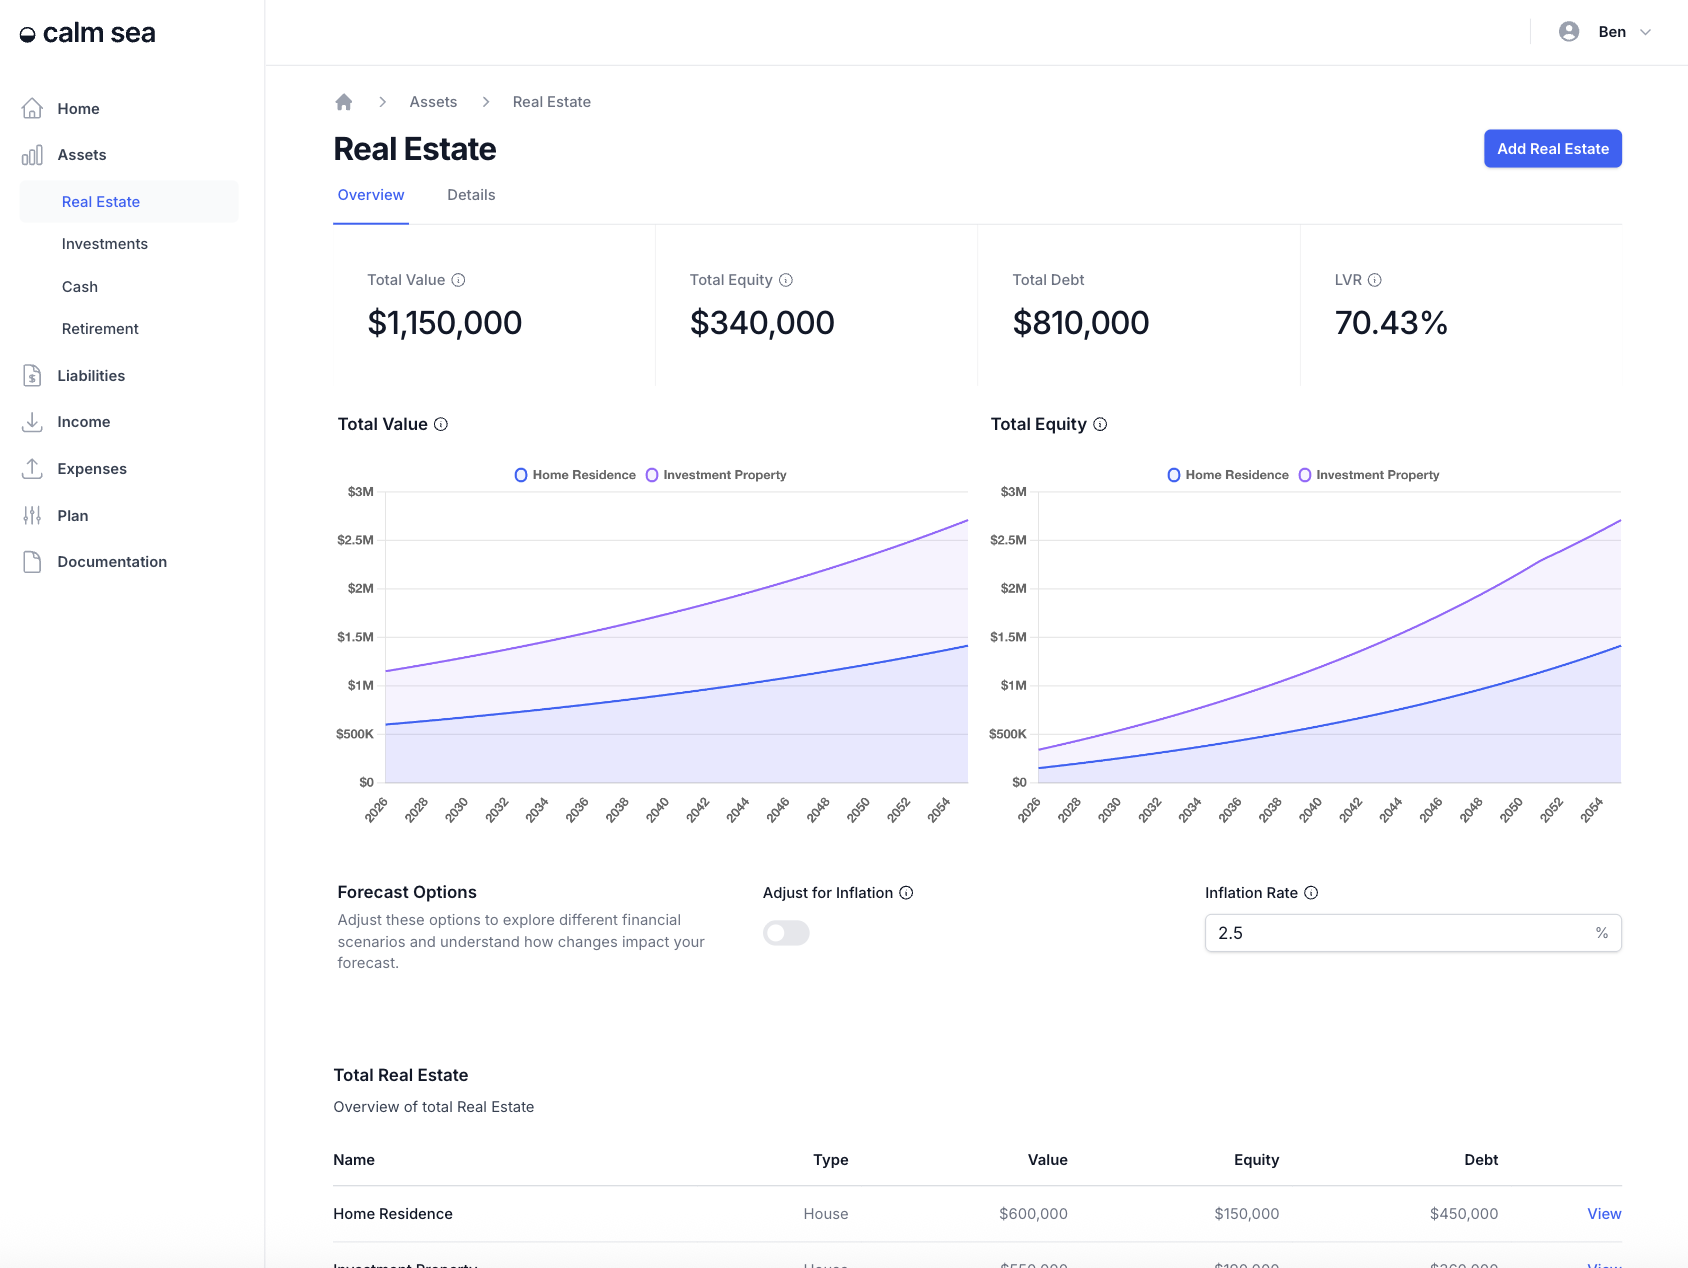
Chart Echo provides users with a platform to visualize market data and understand financial trends. It allows users to create detailed charts and graphs, facilitating better insights into market movements. The tool is designed to make data interpretation straightforward, enabling users to focus on strategic decision-making.
Who Chart Echo is for
This tool is ideal for indie founders, small business owners, and finance professionals who require clear and actionable data insights. It is particularly beneficial for those who may not have access to advanced financial tools or who prefer a simpler interface. However, large corporations with complex financial needs may find it lacking in depth compared to enterprise-grade solutions.
Pricing & access
Chart Echo operates on a Freemium model, allowing users to access basic features at no cost. For advanced functionalities, users may need to explore premium options, though specific pricing details are not specified. Users can visit the product website for the latest information on plans and features.
Key features
- Visualize market data with customizable charts and graphs.
- Track financial trends over time for better decision-making.
- Easy-to-use interface designed for quick data interpretation.
- Access basic features for free with options to upgrade.
- Integrate with existing financial tools for seamless analysis.
Explore more finance & fintech tools on EarlyHunt.


Comments
Sign in to post a comment or reply
No comments yet
Be the first to comment!